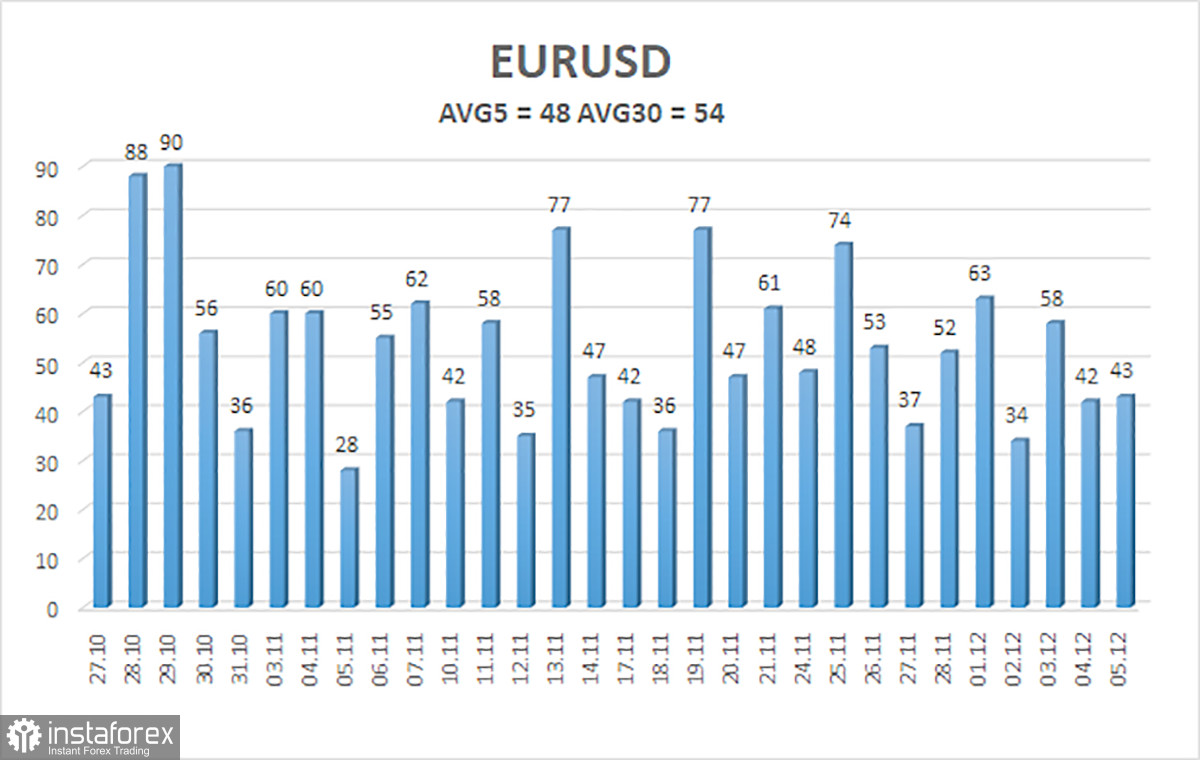
The EUR/USD pair showed only one thing on Friday—a complete reluctance to move in any direction. Overall, there were no significant movements last week, despite numerous important macroeconomic reports. However, the market essentially traded only on Monday and Wednesday, and even then, it seemed like a favor was being done for someone. Throughout the week, we only saw two relatively interesting price movements. As depicted in the illustration below, these two "good movements" were around 60 pips in size, which cannot even be considered strong. In fact, the situation was even worse on the other days.
At first glance at the events calendar, one might describe the upcoming week with phrases like "mess" or "confusion." To start, no critically important labor market or unemployment data from the US was published at the beginning of December. Thus, both the market and the Federal Reserve are still unsure about the current state of the labor market. Meanwhile, the ADP report was released, but it is not precise or comprehensive. The Fed will be forced to make decisions on December 10 based on overtly inaccurate data. Recall that ADP and Non-Farm Payroll reports almost always display differing dynamics and figures.
In the Eurozone, only reports on inflation and industrial production in Germany are expected to be released over the next five days. The Consumer Price Index will be published in its second estimate for November, which is unlikely to generate much interest. It can confidently be claimed that there will be no major events in the EU. What About the US?
In the US, some reports will be published, some will not, and some will be released covering two months at once. It's a mishmash, to say the least. Perhaps the most interesting reports will be the JOLTs data for September and October. These reports are marked as "super-important" in most calendars, but in reality, they are not. Yes, they indirectly reflect the US labor market's condition, but the market does not always react to them; it still prefers to draw conclusions from Non-Farm Payrolls and unemployment data. The data for September and October will be published now. For those who have forgotten, it is December, and the Fed has already cut the key rate twice since September. What significance does three-month-old data hold?
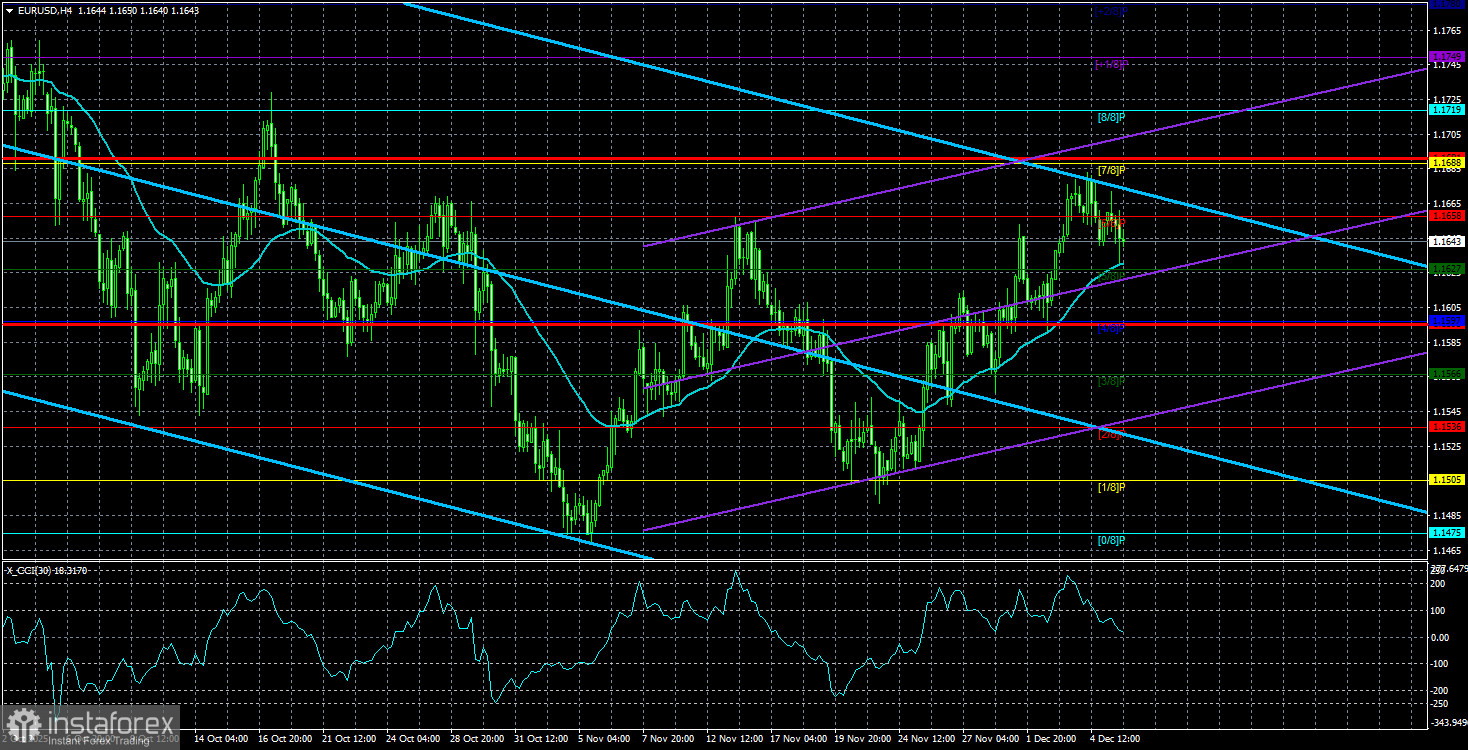
Moreover, there is nothing else of note in the US calendar. A few absolutely trivial reports will be released, such as the weekly ADP or weekly unemployment claims, which may cause price movements of only about 20 pips, given the current trader activity. The market situation will remain unchanged, at least until the FOMC meeting, and even after the Fed's meeting, nothing might change. The EUR/USD pair has been in a flat trend for the past 5 months. Currently, the price is sitting precisely between the bounds of the sideways channel 1.1400-1.1830. The probability of the pair breaking out of this channel this week is minimal.
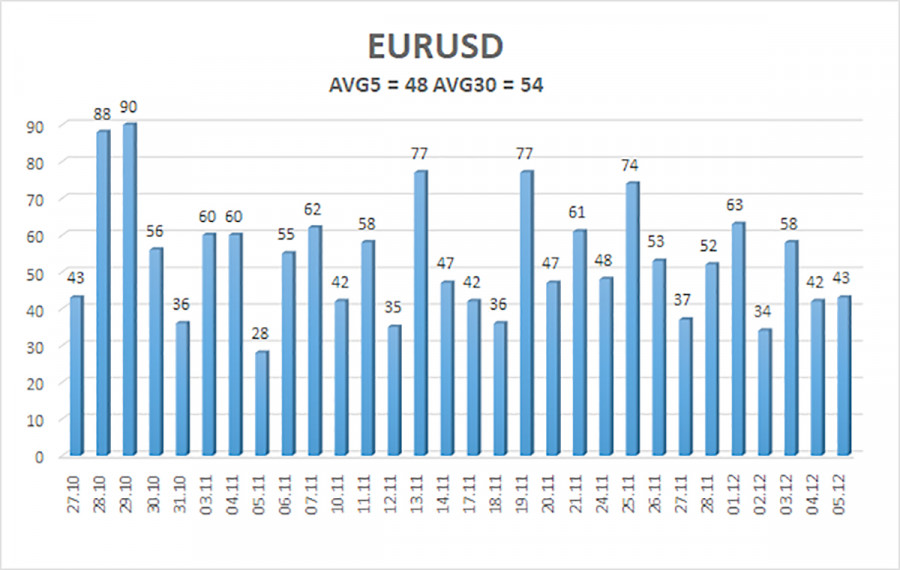
The average volatility of the EUR/USD pair over the last five trading days stands at 48 pips, which is characterized as "medium-low." We expect the pair to trade between 1.1595 and 1.1691 on Monday. The upper linear regression channel is directed downward, indicating a bearish trend, but in reality, the flat movement continues on the daily timeframe. The CCI indicator has entered the oversold area twice in October, which may provoke a new upward trend into 2025.
Nearest Support Levels:
- S1 – 1.1627
- S2 – 1.1597
- S3 – 1.1566
Nearest Resistance Levels:
- R1 – 1.1658
- R2 – 1.1688
- R3 – 1.1719
Trading Recommendations:
The EUR/USD pair is above the moving average line, but the upward trend persists across all higher timeframes, while the daily timeframe has remained flat for several months. For the market, the global fundamental backdrop remains of immense importance. Recently, the dollar has often shown growth, but solely within the bounds of the trading channel. There is no fundamental basis for long-term strengthening. If the price is below the moving average, small short positions can be considered with targets of 1.1597 and 1.1566 on purely technical grounds. Above the moving average line, long positions remain relevant with a target of 1.1800 (the upper boundary of the flat trend on the daily timeframe).
Illustration Explanations:
- Price Levels (Support/Resistance): Thick red lines where movement may end. They are not sources of trading signals.
- Kijun-sen and Senkou Span B Lines: Strong lines of the Ichimoku indicator transferred to the hourly timeframe from the 4-hour timeframe.
- Extreme Levels: Thin red lines where the price has previously bounced. These are sources of trading signals.
- Yellow Lines: Trendlines, trend channels, and other technical patterns.
- Indicator 1 on COT Charts: Represents the net position of each trader category.